LAST UPDATED July 5, 2023
Botnet-based attacks like credential stuffing are occurring more often because credentials are frequently bought, sold, stolen, and leaked. Recent examples of leaks are the Uber breach announced on Sept 16, 2022 (the official announcement can be found here), and the American Airlines breach that was reported the day before on the 15th (more information can be found here).
Learn more about credential stuffing attacks in Credential Stuffing: Examples, Detection, and Impact.
Each data breach allows attackers to aggregate massive lists of emails, usernames, and passwords, which are then supplied to distributed networks of compromised devices in combination with carefully written software. This software, called command and control software, takes the previously breached information to conduct targeted and distributed credential stuffing campaigns by coordinating the attack across all the compromised devices at once.
Below we outline a method for identifying large credential stuffing attacks.
Frequency Distribution
You can use frequency distribution to analyze any piece of metadata, but in this post, we use it to examine the following:
- Unique counts of data elements from requests
- The number of requests per IP
- The ASNs of requests and IPs
- User agents
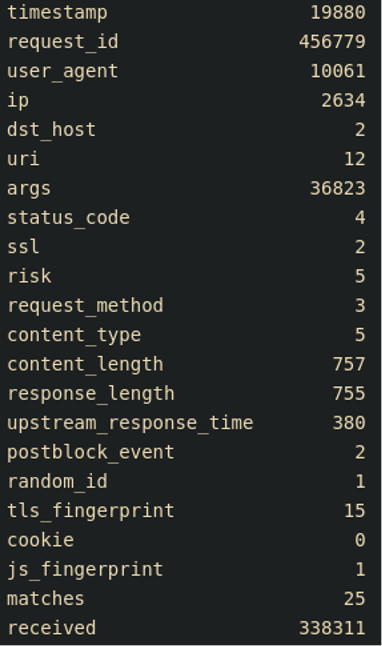
Unique counts of data elements from requests
By analyzing unique counts of data elements from requests, you can identify things like user agent rotation or a disproportionate IP count (see Figure 1).
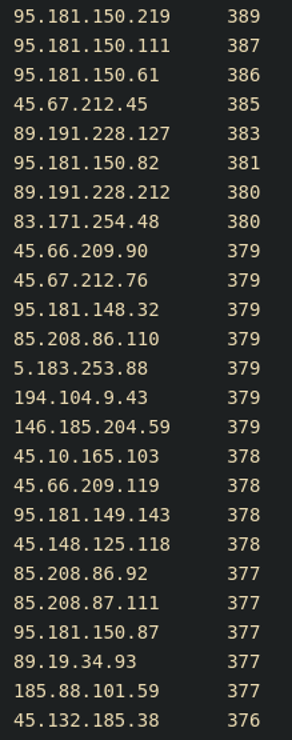
The number of requests per IP
When you evaluate the number of requests per IP, you can identify a request frequency that is a strong indicator of malicious activity.
You can then use this rate in a counting-based rule that can allow for blocking of a particular source if they exceed this static threshold. However, just looking at IPs is not always helpful for several reasons, and often the more distributed the attack is, the less significant a standalone IP becomes. With the following example, we can clearly see an even distribution of attempts made across thousands of IPs (result truncated). Keeping in mind that these should be individual login attempts, anything over a few is significant (see Figure 2).
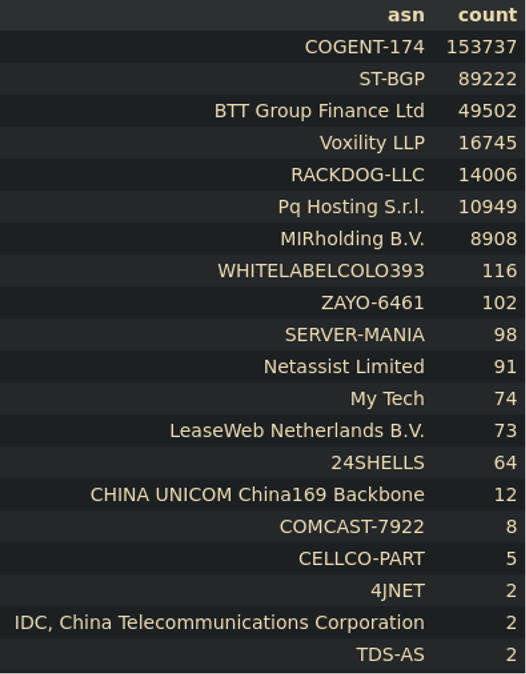
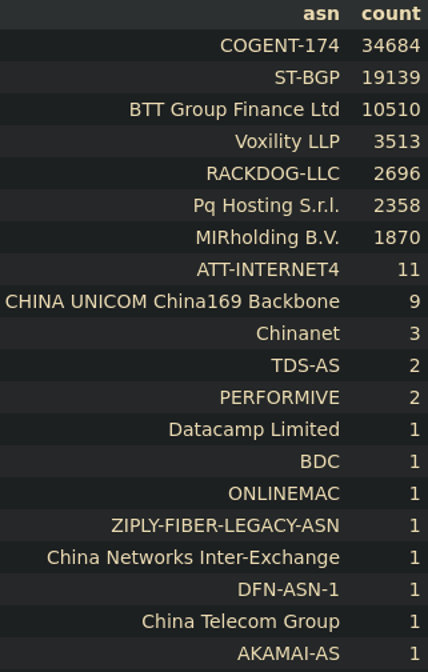
The ASNs of requests and IPs
If you group requests and IPs into their respective ASNs (autonomous system numbers), new information often presents itself, such as attacks coming from one ASN. For example, Figures 3a and 3b show two attacks that occurred within 24 hours of each other and on two separate, mostly unrelated, credit unions. The overlap between the two is clear, and the line denoting which ASNs were most used is also clear.
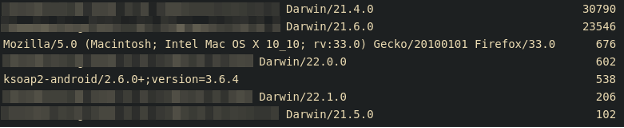
User agents
Finally, you can analyze user agents to identify where an attack originates. Keep in mind that user agents can be misleading due to the ease of spoofing a UA during an attack, as well as the ease of rotating through a static list of UAs as an evasion technique. However, in Figure 4, we can see that the primarily used UAs lead to further validation that this attack is in fact originating from a mobile application.
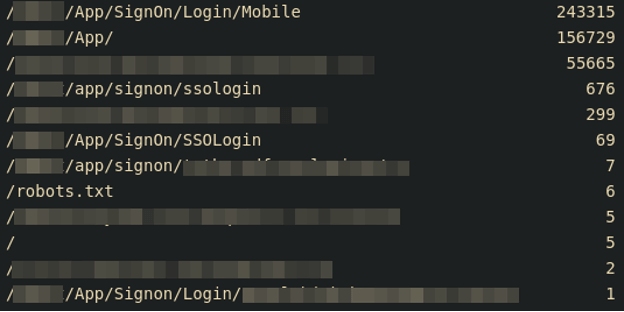
Analyzing User Flow
You can use URIs (uniform resource identifiers) to determine the path, or flow, the user is taking through an application. By identifying the flow of a normal user, it can become apparent when an attack is accessing an endpoint that is not typically accessed directly. In Figure 5, for example, this mobile application requires the user to load an initial page before receiving the fields to enter a username and password.
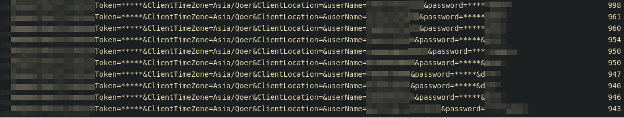
Analyzing Arguments
Finally, we get to ARGs (arguments) and can clearly see examples of credential stuffing attempts being made with the same ClientTimeZone. In Figure 6, when looking at the unique counts, the expectation for credential stuffing is to see an even distribution of attempts being made, assuming you pre-obfuscate unique tokens and passwords.
For More Information
The analysis method outlined here should give you a quick and straightforward way to identify key pieces of information from distributed botnet-based attacks that can be used to subvert these attacks.
In the example we walked through above, we can conclude that this attack:
- Was credential stuffing
- Used either mobile emulators, compromised mobile devices, or mobile device farms
- Was distributed across 2,624 IPs
For more details on this attack, see the ThreatX Labs research report, Trends in Credential Stuffing and How to Identify It.