After connecting hostnames to ThreatX, real-time attack information will be displayed via the Attack Dashboard and API Defender in the ThreatX platform. Use the latest available sensor version to see all information populated on the ThreatX platform.
ThreatX Attack Dashboard
Introduction
ThreatX’s Attack Dashboard provides complete visibility into how the solution protects APIs and web applications from cyberthreats. In the dashboard, security teams and application owners can see essential data collected about each API endpoint, web application, or web site protected through the platform. ThreatX analytics automatically correlate enormous amounts of data – about suspicious and malicious traffic ThreatX has identified, tracked, and blocked – so that teams have the real-time situational awareness needed to keep their Internet-facing assets safe and secure.
How It Works
The Attack Dashboard is comprised of three main views: Threat Entities, Top Targets, and Threat Map. Each view poses a different perspective of an organization’s attack surface, as shown below in Figure 1.
Data displayed in the dashboard is live and is driven by active site traffic. By default, the data displayed will update every few seconds with real-time dynamic data. Platform users can also specify a fixed view of historical data, using the time picker to zero in on specific time frames. An interactive graph and high-level details, such as request statistics and maximum entity risk, are displayed in a banner throughout the three main views of the dashboard. By hovering over a point on the interactive graph, users can view the total numbers of matched and blocked requests for specific times to prompt further investigation into the attack state of an entity.
Threat Entities
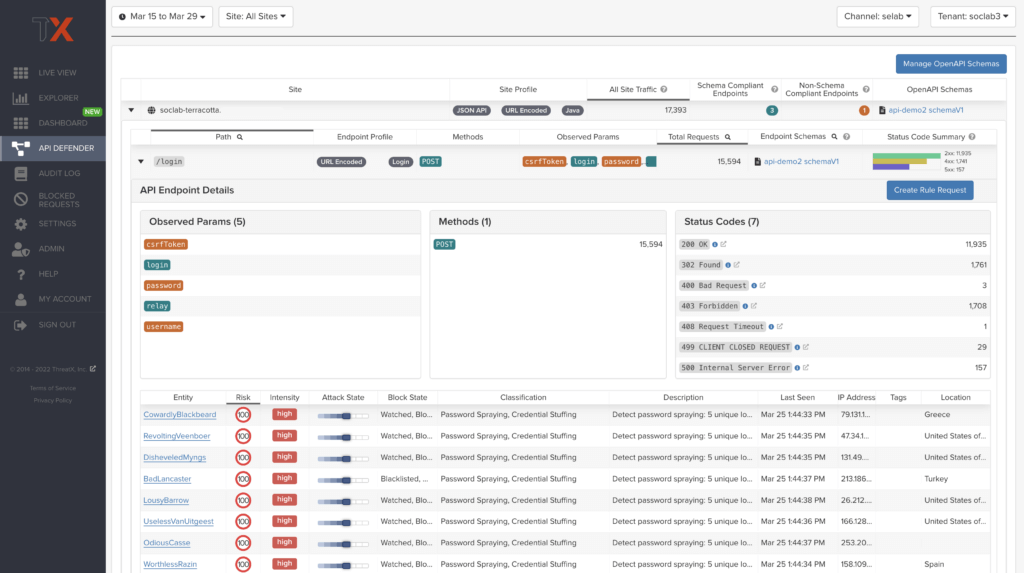
As ThreatX analyzes HTTP traffic, the platform extracts identifying metadata, including IP address, user agent, TLS fingerprint, and other characteristics to create a profile and identifier for each attacker. The Threat Entities view provides the visibility security teams need to quickly evaluate Entities prioritized by risk and to drill into the fully correlated view of suspicious and malicious behaviors observed. Users can further search, sort, and filter based on specific attack states and classifications to better understand the implied risk.
As shown in the figure below, the information is clearly presented with special emphasis on key attributes to further help identify trends and patterns.
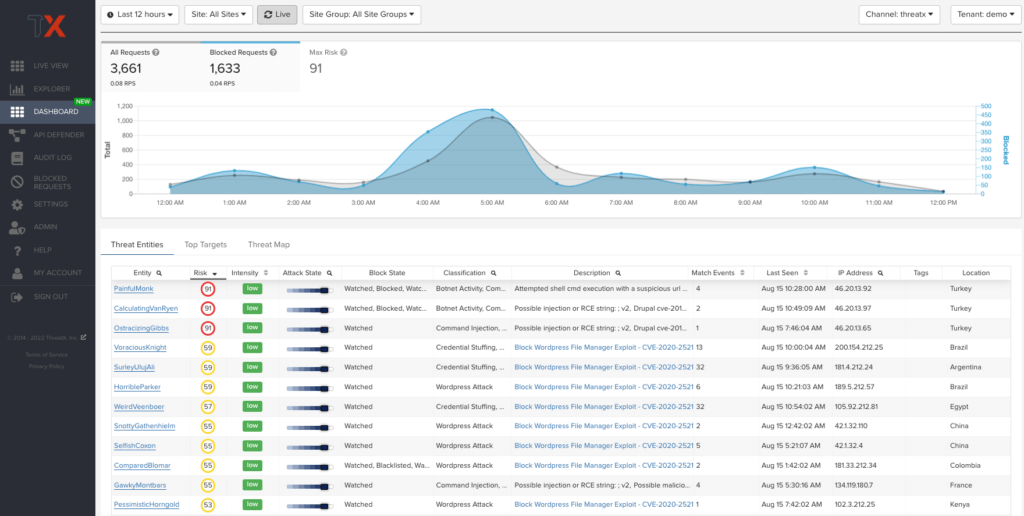
Remembering specific IP addresses can be difficult, and it’s common for attackers to use multiple IPs in a single attack. Therefore, ThreatX uses a human-readable name format consisting of a “negative” adjective (like Smelly) and a pirate name (like Blackbeard) to identify each unique attacker. ThreatX users will see lists of entities containing names like SmellyBlackbeard, AnnoyingSpider, and MoodyMorris.
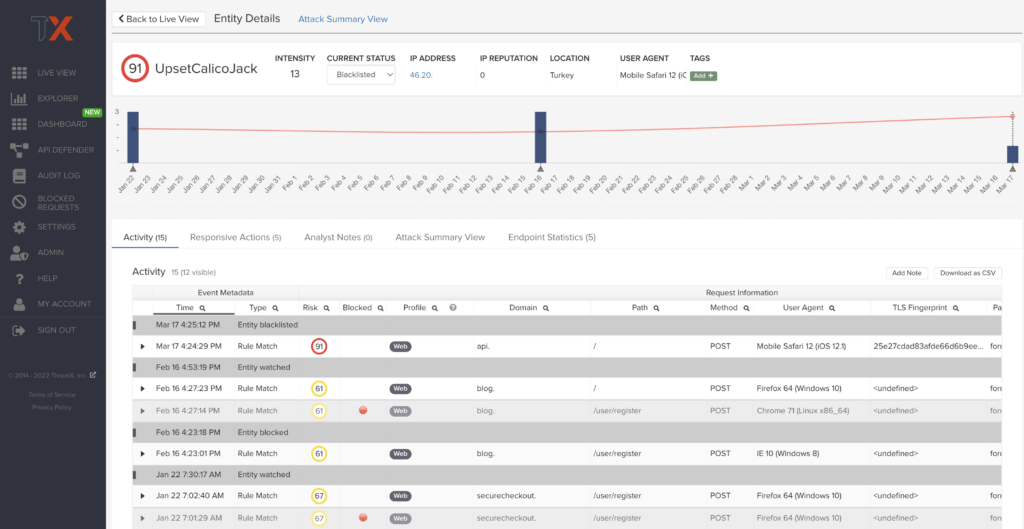
By clicking on a specific Entity name in the Threat Entities view, users will be taken to the Entity Details page where they can view more specific event metadata and request and response information.
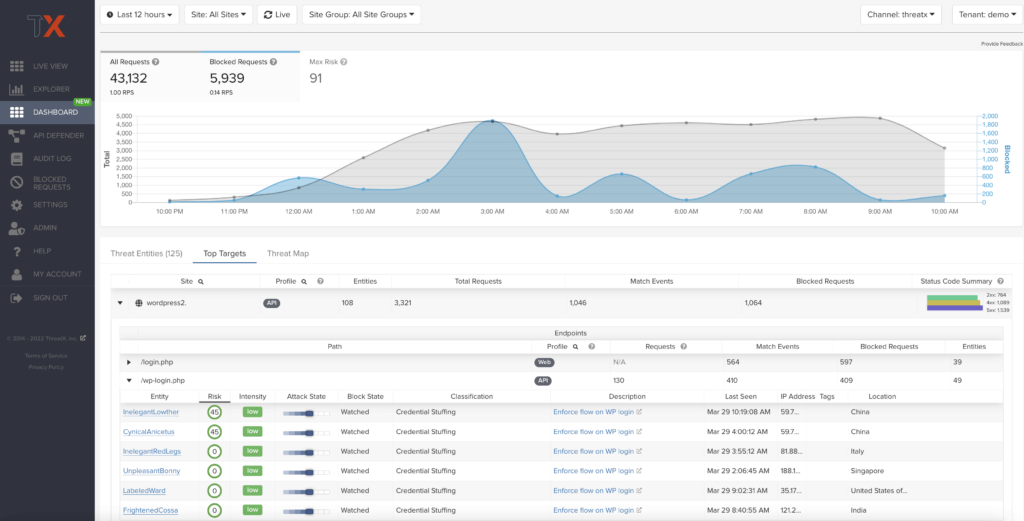
Top Targets
The Top Targets view features API and web hostnames that have been targeted during the time selected. Administrators can easily see the assets that are most frequently or aggressively targeted, gaining insight and understanding of their risk profile, and the protection they are receiving from ThreatX. The Top Targets view makes it easy for the user to drill into each hostname to view the details for each path.
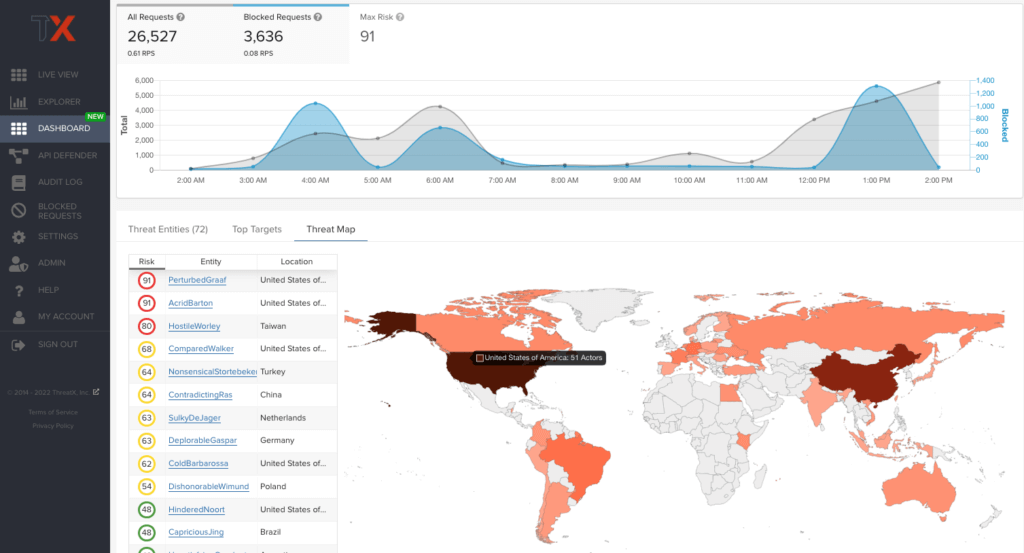
Threat Map
Threat Map is another key view in the Attack Dashboard. It provides visibility into the location of each unique entity and its associated risk. The interactive map allows the user to identify how many unique attackers are acting from each country. Users can hover over a country on the Threat Map, and a popup will display the number of attacking entities originating in that country.
ThreatX API Defender
Introduction
The API Defender dashboard provides visibility into the APIs and their endpoints discovered and protected by the ThreatX platform. API traffic analytics, error code summaries, and a visualization of API schema conformance are displayed in API Defender, as shown below in Figure 5, providing the ability to compare what API traffic is expected vs. variances against your organization’s API specifications. The API Defender dashboard brings together API discovery, observability, and the context needed to understand your organization’s entire attack surface and what is being seen in the wild.
ThreatX’s API Defender makes it easier than ever for organizations to drill into the finer points of API attacks. With a comprehensive set of data available, customers can quickly take responsive actions, such as enabling automatic blocking, establishing geo-fencing to block traffic from parts of the globe where there shouldn’t be clients, or tarpitting attacks to prevent overconsumption of backend resources.
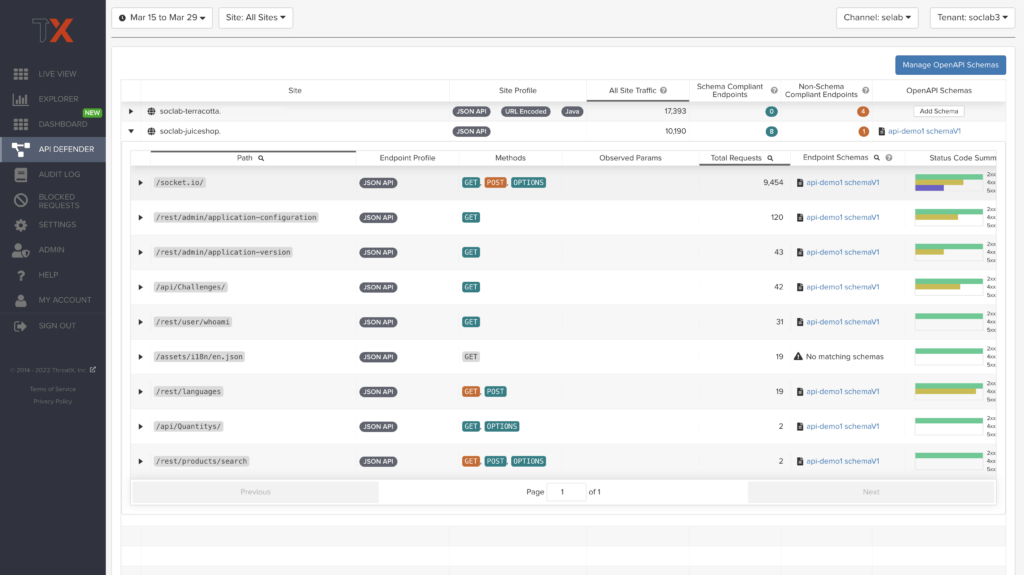
API Discovery
ThreatX’s API Discovery capabilities analyze and profile legitimate, suspicious, and malicious API use to discover and enumerate endpoints. While monitoring API interactions in real-time, ThreatX can accurately detect real API endpoints and determine their active tech stacks or markup encodings for JSON, XML, GraphQL, and URL-encoded endpoints. The ThreatX platform is actively expanding its support for additional API tech stacks such as gRPC and SOAP.
How It Works
The API Defender page will appear empty until ThreatX’s API Discovery analyzes traffic hitting API endpoints. ThreatX API Discovery determines if an HTTP target is an API endpoint by decoding the target path of the request and parsing the payload to identify API calls. ThreatX can accurately detect real API endpoints and determine their active tech stacks or markup encodings for JSON, XML, GraphQL, and URL-Encoded endpoints. The ThreatX platform is actively expanding its support to profile additional API tech stacks such as gRPC and SOAP.
If an endpoint is not displayed within the API Defender page, it hasn’t been profiled yet. This does not mean the API is not protected, but rather that our profiling analytics haven’t yet collected the required criteria to profile the endpoint as an API. ThreatX’s protection-first approach will still protect the API from attacks, even before it crosses the profiling threshold.
API Observability
ThreatX’s API Discovery analyzes and profiles endpoints on a given site, and any inaccurate paths being displayed as endpoints will fall off the API Defender page as ThreatX continues to baseline and make profiling decisions based on traffic being observed. Ultimately, the API Discovery capabilities provide analytics on actual traffic hitting real endpoints or attackers blindly targeting common or well-known directory paths with API fuzzing or API enumeration techniques. This gives teams complete visibility into expected and suspicious API traffic hitting their API attack surface.
Schema Compliance
The API Defender dashboard gives users the ability to upload, manage, and cross-compare which API traffic is expected according to your organization’s schema vs. what is being seen in the wild. Manage your organization’s API schemas within the API Defender page to gain risk visibility and simplify schema enforcement. API traffic analytics will display and highlight the anomalies seen based on your organization’s API specifications, as seen in Figure 7.
In addition, ThreatX’s real-time discovery capabilities pinpoint API endpoints that may be out of the view of security and development teams, such as zombie and rogue APIs. Overall, these capabilities give an organization a holistic and clear picture of their API attack surface, along with an understanding of when and where APIs are being managed appropriately. Build more confidence in your API specifications with the ability to customize or create API-centered protection rules.
Last Updated 2023-07-14