The ThreatX Analyst guide focuses on those areas of the ThreatX™ Managed API and Application Protection platform that provide analytical data. Security analysts can use the data to perform various tasks, including:
- Monitor changes.
- Review details about a specific attack.
- Determine if traffic from an origin is to be allowed or blocked.
- Identify unexpected usage patterns.
- Allow, deny, or temporarily block specific traffic.
You should be familiar with the various terms used in the ThreatX platform and this guide. The terms are defined in the Glossary.
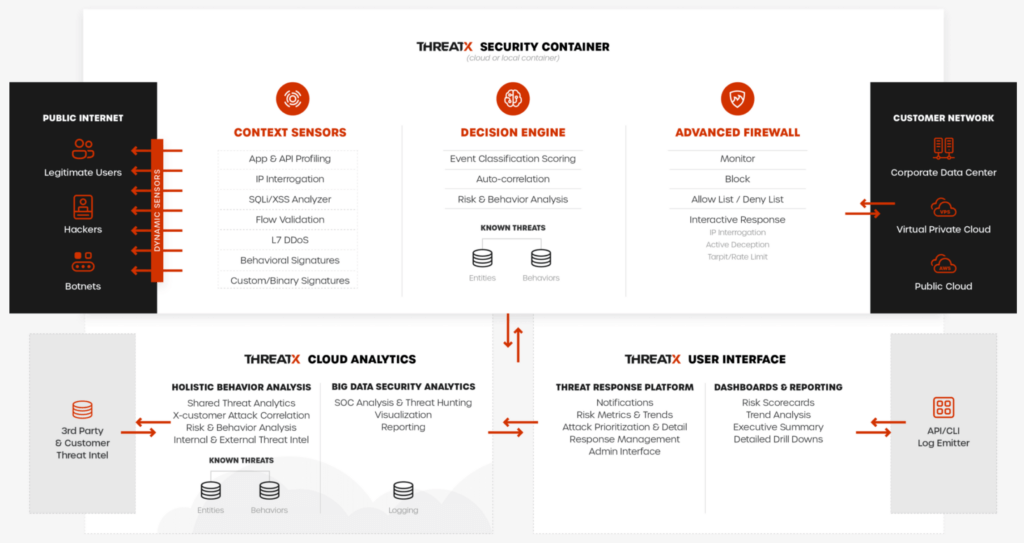
ThreatX platform
The ThreatX platform is designed to protect applications from the full breadth of Layer 7 security threats, including traditional OWASP attacks, malicious automation, DDoS, and API-specific attacks.
Architecture
ThreatX sensors channel your ingress traffic through the ThreatX platform, analyzes API traffic for threats, and performs actions as needed, including block, tarpit, and IP interrogation, before sending the traffic to your environment.
API traffic is traffic that includes HTTP messages containing programmatic content sent between the site and client applications.
The ThreatX platform provides metrics and analytical data of API traffic and actions taken to the dashboards and reporting pages, which is shown in the following diagram as the ThreatX user interface section.
Attacker-Centric Behavioral Analytics
The ThreatX platform uses Attacker-Centric Behavioral Analytics (ACBA), which is an approach that identifies critical elements of an attack, responds to them before any damage is done, and maintains protection even if attackers change or obfuscate their attack pattern to avoid detection. The ThreatX platform delivers a range of responsive actions, including blocking, IP interrogation and challenges, and targeted rate limiting which is also known as tarpitting.
ACBA continuously monitors all users as they interact with an application or API. It looks for key indicators of suspicious behavior and tracks risk over time and across multiple applications. Combining these indicators helps the system track malicious or suspicious users across many IP addresses as they use various evasion techniques and modify attack parameters. Individual requests might be blocked based on severity, but the approach is designed to limit false positives and identify the truly malicious users to be blocked.
The ThreatX risk engine also tracks attackers over time, observing risky behavior that is not obviously malicious on the basis of a single request, but exhibits a pattern of risky behavior known to be associated with malicious actors. This data is correlated in the activity logs and can be displayed in the Dashboard.
Rules
A ThreatX WAF rule is a set of Boolean conditions that, when True, implement the rule’s defined action and risk level. A True state is known as a match. The conditions are based on threat, request, or response attributes.
The rule’s action is implemented by the ThreatX WAF sensor. The sensor also provides a curated set of common behavioral rules designed to identify risky behavior while minimizing false positives against legitimate users.
The ThreatX dashboard displays how often a rule is matched and implements its action. You can use this data to determine the effectiveness of each rule. As needed, you can request the ThreatX SOC group to create new rules or modify any rule in the ThreatX platform to meet the specific needs and behavior of your environment.
The ThreatX platform uses rules with advanced analyzers, IP interrogation techniques, and a combination of other detection capabilities working in parallel to observe traffic.
Analytical data
The ThreatX platform gathers, organizes, and presents the data it collects into various pages and tables. The tables provide different perspectives of how the data relates to each other, which can help in your analysis.
The following sections describe each major type of data provided in the tables.
Sites
The ThreatX platform displays all the sites under the ThreatX protection, the API profile for each site, and every endpoint for each site.
A site is a web property serving API responses intended for consumption by an application. It is also called an API site. An endpoint is a URL pattern representing a group of resources within a site. A site can have multiple endpoints. The API profile is a type of API such as JSON, XML, and URL-encoded.
The ThreatX platform shows the sites by their hostname. You can drill-in to a site to see its endpoints and the activity at each endpoint.
Threats
A threat is a representation of individual API clients or network of clients that have engaged in an activity that matches one or more rules and is therefore identified as suspicious or questionable. A threat is suspicious but not necessarily malicious.
Where it is common for attackers to use multiple IPs in a single attack, the ThreatX platform generates a name for each threat based on the IP addresses of the attacking entity. The name is in a human-readable format consisting of a “negative” adjective (like Smelly) and a pirate name (like Blackbeard) to identify each unique attacker.
The tables in the ThreatX dashboard provide analytical data about the threat. The following metrics are common to a number of tables.
- Status. Current response to the threat. Status includes Watched, Blocked, Allow Listed, or Deny Listed.
- IP Address. Origin of the threat.
- Last Seen. Time of the last request.
- Location. Country where the attack originated.
- Attack Class. Category of the threat, such as XSS, password guessing, and Trojan activity.
Risk Score and Risk Level
There are two risk attributes:
- Risk Score is associated with a single activity of a threat, and is signature specific. The ThreatX platform displays Risk Score as a number between 0 and 100. The higher the score, the greater the risk.
- Risk Level is associated with all activities of a threat. The level is calculated from many inputs including Risk Score. One input is the kill chain model that classifies the attacker behavior and methods used to attempt to gain unauthorized access or control. The higher on the kill chain, the greater the severity of the threat. The ThreatX platform displays Risk Level severity as a bar. The longer the bar, the greater the risk.
Many of the tables in the ThreatX platform show Max level, which is the maximum Risk Level in the specified time range.
Rule activity
The rule activity is the number of times the rule was matched by requests within a specific time range. The rule activity is shown as Intensity, which can be measured as Low, Medium, and High or as a number.
The ThreatX platform displays the rules that were matched in various tables. Clicking a rule name in the Rules column of a table displays that rule’s activity page. Clicking a rule name in the Description column displays the properties for that rule.
Data controls and filters
The ThreatX dashboard pages provide the following controls and filters that you can use to focus on specific data.
- Site group. If your ThreatX platform organizes sites into groups, you can choose which group to view. You can view one site group or all site groups.
- Sites. You can display the data for one or all sites.
- Tenant. If your ThreatX platform contains multiple tenants and your account has permission, you can choose which tenant to view. You can view one tenant only at a time.
- Live. Refreshes the data.
- Time range. Choose the time frame to view the data. You can choose a relative time frame, such as the last 12 hours, or an absolute time frame. The time range you select for each page affects the data shown on that page.

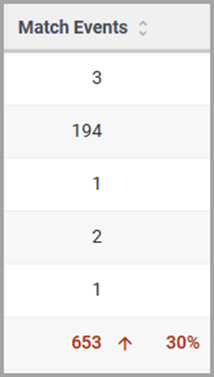
Some data in the various tables include a percentage with an arrow. The value indicates a change in the data relative to the baseline reporting period, which is 7 days prior to the selected time range. For example, when you select a 12-hour time range, the baseline period is the same 12-hour period from 7 days previous. The arrow indicates an increase or decrease in value. The following figure shows an increase in the number of Match Events of 30%.
Allow, deny, and block lists
You can use the following lists to always deny, temporarily block, or always allow specific entities. An entity is a specific IP address or IP group. A suspicious entity is a threat.
- Blacklist. An entity in the list is prevented from interacting with any of your sites.
- Blocklist. An entity in the list is prevented from interacting with any of your sites. The block lasts for 30 minutes from the time the entity was added to the list. All requests made while the threat is blocked are tracked for valuable threat intelligence.
- Whitelist. An entity in the list cannot be blocked or denied.
You can add an entity as an IP address or CIDR to any of the lists manually, as described in Managing threats in the Managing analytical data section. You should exercise caution when manually adding a threat to the Blacklist or Whitelist to prevent a problem with legitimate traffic or always allowing malicious traffic.
If the ThreatX Risk-Based Blocking feature is enabled, the ThreatX platform can add a threat automatically to the Blacklist or Blocklist based on the threat’s behavior. The ThreatX behavioral analytics engine, hackerMind™, blocks persistently malicious threats when the threats’ behavior surpasses the Risk-Based Blocking threshold. The analytics engine automatically places a threat on the permanent Blacklist after it is blocked three times.
Once added to the Blacklist or Whitelist, the entity remains there permanently until it is manually removed. A user who has Write Access can manually remove an entity from the list, or you can request the ThreatX SOC to remove the entity.
ThreatX Dashboard
Data from the sensors is displayed in the pages provided by the ThreatX Dashboard.
The following sections describe the pages and data. Some features are optional; therefore, depending on your ThreatX configuration, some pages might not be available.
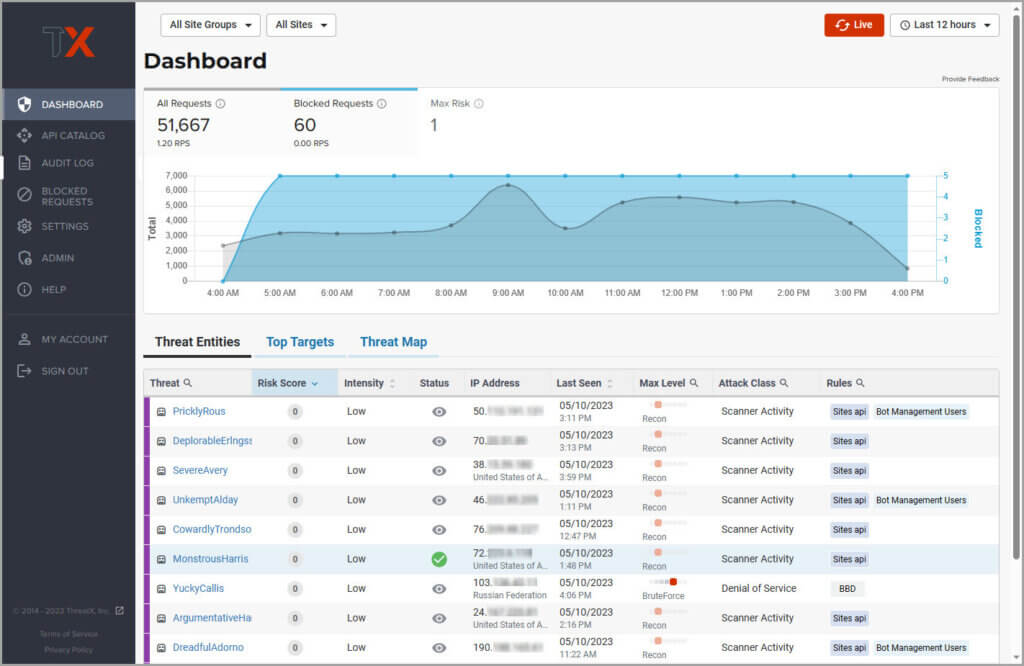
Dashboard
The Dashboard, available from the navigation bar, displays essential data collected for each site in your environment under ThreatX protection. The data is live and driven by active site traffic.
By default, the ThreatX platform updates the data every few seconds. You can choose to display historical data by selecting a time frame, as described in the Data controls and filters in the Analytical data section.
You can use the data for various analytical tasks, including:
- Monitor changes.
- Review details about a specific threat.
- Determine if traffic from an origin is to be allowed or blocked.
- Identify unexpected usage patterns.
The Dashboard includes graphs and three tables, which are described in the following sections. Each table is a different perspective of the organization’s attack surface. For detailed information about the data in the table, see Analytical data.
Graphs
The Dashboard includes three interactive graphs.
- All Requests. Displays the total number of requests, including benign requests, within the selected time range. It also displays the average number of Requests per Second (RPS). The associated chart displays the number of requests over the selected time range.
- Blocked Requests. Displays the total number of requests that were blocked within the selected time range. It also displays the average number of RPS. The associated chart displays the number of blocked requests over the time range.
- Max Risk. Displays the highest system Risk Score recorded during the time range selected. The associated chart displays the maximum Risk Score at each time interval.
You can hover over a point on any graph to display the metrics at that time.
Threat Entities
The Threat Entities table provides the visibility security teams need to quickly evaluate threats prioritized by the Risk Score and Intensity, which represents the number of times rules were matched over the selected time range.
You can drill into the threat to view specific metadata of that threat, as described in Entity Details. You can also drill into each rule that was matched to see its specific activity, as described in Rule Activity.
If you are unfamiliar with the Status icons, you can hover over the icon to see its definition.
Top Targets
The Top Targets table focuses on the sites that are most frequently or aggressively targeted by attacks.
The table includes the following data.
- The Entities column shows the number of threats that targeted the site.
- The Match Events column shows the number of times one or more rules were matched.
- The Status Code summary field shows the number of responses for each HTTP code and a logarithmic scale to illustrate the relative difference between the numbers.
You can drill into a site to view its endpoints, which are displayed as paths.
Threat Map
Threat Map provides visibility into the location of each unique threat and its associated risk. The interactive map allows the user to identify how many unique attackers are acting from each country. You can hover over a country on the map, and a popup displays the number of attacking threats originating in that country.
Entity Details
The ThreatX platform analyzes HTTP traffic then extracts identifying metadata, including IP address, user agent, TLS fingerprint, and other characteristics to create a profile and identifier for each attacker, which is displayed in the Entity Details page. The data is presented with special emphasis on key attributes to further help identify trends and patterns.
The Entity Details page is accessible by clicking a threat on another page, such as the Dashboard.
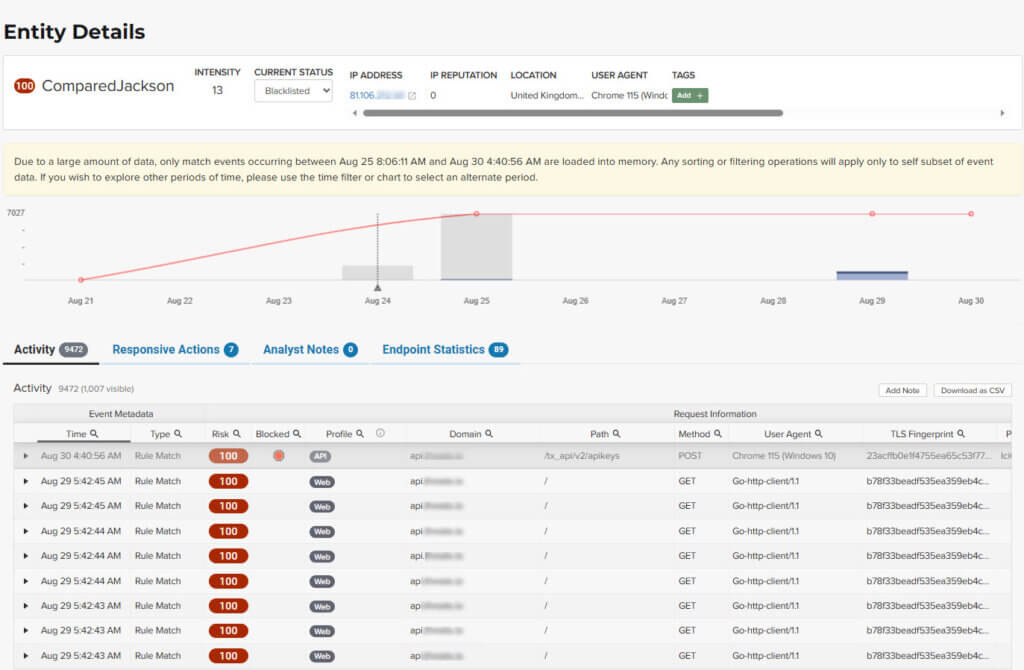
Metrics
At a glance, you can see the following data:
- Risk Score.
- Threat name.
- Intensity. Represents the number of times rules were matched over the selected time range.
- Current Status. The current action taken on the threat. You can change the action as needed. See the Managing threats section in the Managing analytical data for details.
- IP Address. If available, you can click the address to see any data about it in the ViewdnsInfo web site.
- IP Reputation. Represents the legitimacy of the IP address with a score of 0 to 100. The higher the score, the more likely that the IP address is legitimate. A low score can indicate an attacker. A score of 0 could mean that the IP reputation is unknown. The scoring system is the opposite of Risk Score.
- Location. Country of origin.
- User agent. The program that sent the request on behalf of the user, such as a web browser or curl, as indicated in the User-Agent header field.
- Any tags assigned to the threat. If your account has permission, you can add a tag to track similar threats.
- Chart that displays the attacks over time. You can hover over various locations for details of the threat at that time.
The Entity Details page includes tables, which are described in the following sections. Each table is a different perspective of the organization’s attack surface.
Activity
The Activity table provides the following data in addition to the site and threat data described in Analytical data.
- Type. If there was an action taken on the request, the column shows the action which can be Watched, Blocked, Whitelisted, or Blacklisted. If there was no action taken, then the Type is Rule Match when the request matches a rule.
- Risk. Risk Score.
- Blocked. A red dot indicates that a request from the threat was blocked.
- Profile. API Profile.
- Domain. Also referred to as a site.
- Path. Also referred to as an endpoint.
- Method. API call used by the threat.
- TLS fingerprint. Digital certificate fingerprint of the threat.
- Parameters. URL query parameters of the request, if present.
- Content-type. Also referred to as an API profile. Content types can be application/json, application/xml or text/xml.
- Request ID. Random string generated by the ThreatX platform to help identify each request that passes through the ThreatX sensors.
- Status. HTTP response code unless the threat is blocked.
- Size. Length of the response in bytes.
- Time (ms). Time taken to receive the response from the upstream server.
- Description. Lists the rules that were matched by the threat. You can click a rule to display the properties for that rule.
- Count. Number of rules matched by the request.
You can click the search icon in each column header to filter the table. The search icon for some rows also display a count of each type of entry. For example, the Domain row would show every type of domain and the number of each.
If a threat is active, you can see the following changes in the Activity table.
- Additional events with Rule Match in the Type column.
- Increasing Risk Score.
- If your ThreatX platform has the auto-blocking feature enabled, the threat is blocked when it exceeds the auto-blocking threshold and you see a red dot in the Blocked column.
Blocking is a temporary action and the block is released after a period of time. The Type column changes to Watched. If that entity is still active, you might see more entries with Rule Match. However, some attackers try a few requests, get blocked, give up and do not return.
Responsive Actions
The page lists each action taken against the threat.
Analyst Notes
The page lists any notes left by an analyst.
You can add a note to provide additional data or observations, along with any recommendations or instructions.
Endpoint Statistics
The page lists the endpoints that were targeted by the threat. It contains two tables.
- API endpoints table lists the endpoints and their API profile.
- Non-API endpoints table lists the targeted endpoints of non-API sites and the number of rule matches. A non-API site is a site not served by an API server. Typically, a non-API site has web assets which are used for human interaction.
The non-API endpoints table might list API endpoints when the ThreatX profiling engine is actively determining if the site is an API or web service site.
Rule Details
The Rule Details page displays a rule’s properties, its conditions, and the actions it takes when the conditions are matched.
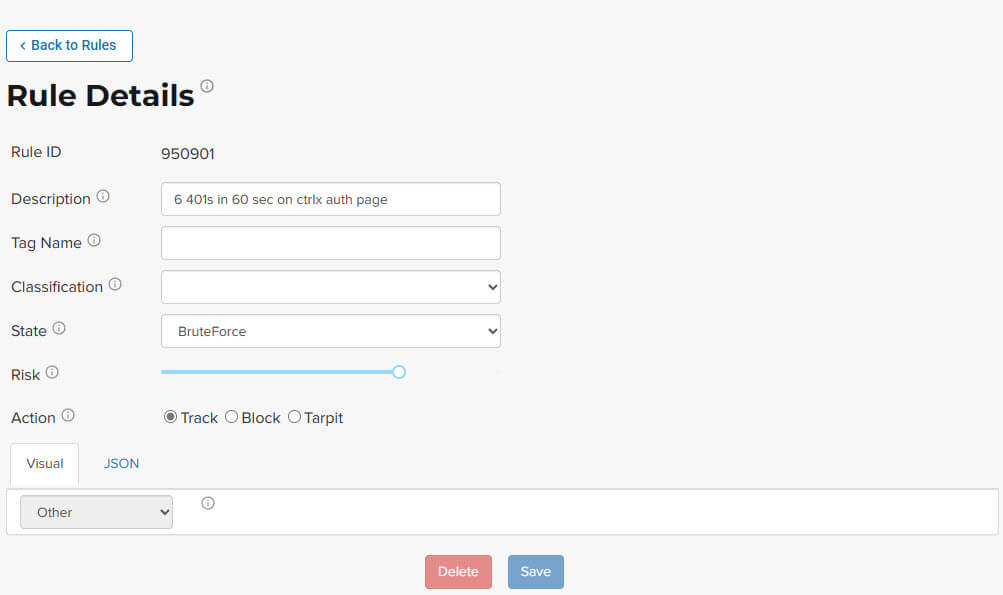
The properties include:
- Description. Text that defines the behavior or purpose of the rule.
- Tag Name. Brief text to identify the rule. The tag is used to identify a rule when a description is long.
- Classification. Describes the type of attack which the rule assigns to a threat. The classification displays in various tables as the attack class.
- State. Assigns the threat’s assumed objective when the request matched this rule.
- Risk. Assigns the Risk Level to the attack.
- Action. The action that the rule performs when responding to a threat. The action is shown in the Status column in various tables. Actions include:
- Track. Begin or continue tracking a risk score for the offending entity, based on the risk assigned to this rule and other factors.
- Block. Immediately block the request and track a risk score for the offending entity.
- Tarpit. Limit the speed at which the offending entity receives responses and track a risk score for the entity.
- Interrogate. Challenge an offending entity with a cookie and attempt to fingerprint the user-agent.
The Visual and JSON tabs display the programmatic rule conditions in a Visual or JSON format.
The Rule Details page is accessible from various tables by clicking a rule name in the Description column. It is also accessible for the navigation bar by opening Settings then clicking Rules. From there, you can access a rule’s details page.
Rule details are read-only unless your account has permission to edit rules.
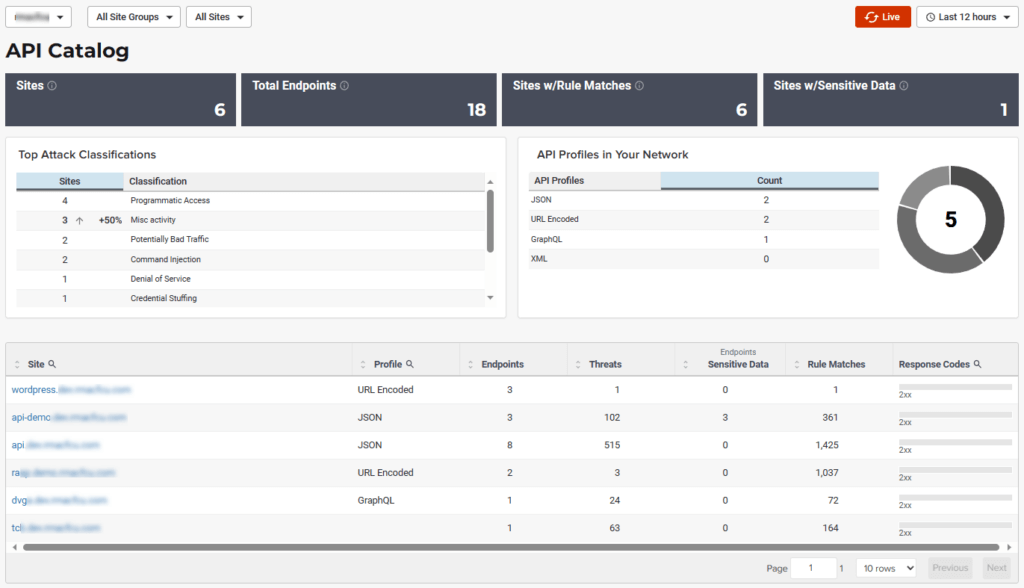
API Catalog
The API Catalog displays statistics about the API traffic to the sites in your environment under ThreatX protection. It lists all the known sites, their endpoints, any threats or attacks, type of attack, and the number of times API traffic at a site matched a rule. You can view details about a specific site and then view details about a single endpoint within the site.
If your account has the Sensitive Data feature, the ThreatX platform monitors API responses to detect various data types as shown in the following table. The metrics within the API Catalog indicate the data type, counts and which sites and endpoints are exposing the data.
| Data Type | Classification |
| Bearer Token | Authentication Credentials |
| Credit Card – AMEX | Payment Card Industry Data Security Standard (PCI-DSS) |
| Credit Card – Diners Club | Payment Card Industry Data Security Standard (PCI-DSS) |
| Credit Card – Discover | Payment Card Industry Data Security Standard (PCI-DSS) |
| Credit Card – JCB | Payment Card Industry Data Security Standard (PCI-DSS) |
| Credit Card – Maestro | Payment Card Industry Data Security Standard (PCI-DSS) |
| Credit Card – MasterCard | Payment Card Industry Data Security Standard (PCI-DSS) |
| Credit Card – Visa | Payment Card Industry Data Security Standard (PCI-DSS) |
| Individual Taxpayer Identification Number (ITIN) | Personally Identifiable Information (PII) |
| Passport – Next Gen | Personally Identifiable Information (PII) |
| Social Security Number | Personally Identifiable Information (PII) |
The ThreatX platform reports only sensitive data that is in plain text. It does not report partial or obfuscated data, such as ***-**-1234. The ThreatX platform does not correlate sensitive data with rules or threats or store sensitive data due to security and compliance reasons.
The catalog displays changes over time so that you can determine if there are any trends that need attention.
You can use the data in the API Catalog for various analytical tasks, including:
- Monitor changes.
- Review details about a specific attack.
- With the Sensitive Data feature, detect sensitive data within API transactions and take appropriate actions.
- Determine if traffic from an origin is to be allowed or blocked.
- Verify that all expected sites are included in the API Catalog.
- Identify unexpected usage patterns.
- Identify endpoints with high error rates.
- Identify endpoints experiencing high levels of attack traffic.
- Request a change to the rules as needed.
Over time, the number of endpoints in the API Catalog might change as the ThreatX API Profiler confirms endpoints or determines that an endpoint was inaccurate. The API Profiler is a function within the ThreatX Sensor that detects, categorizes, and archives API traffic patterns for later analysis within the ThreatX platform.
Metrics
The first row of tiles on the API Catalog page is a quick status for the following metrics:
- Number of sites in your environment.
- Number of endpoints.
- Number of sites with a rule matches. A rule is matched when a request or response in the API traffic matches the criteria in at least one rule within the selected time frame.
- Number of sites where sensitive data was exposed, if the Sensitive Data feature is enabled.
The next row lists the Attack Class with the highest number of attacks within the time period, and the number of each API profile type in your environment.
The table organizes the data by site and includes the following:
- The Endpoints, Threats and Rule Matches columns show any changes to the number of endpoints or threats with an up or down arrow and the percentage of change.
- If present, the Sensitive Data column shows the number of endpoints that passed sensitive data. Any change over time is shown as a percentage.
- The Threats column shows the number of threats, not the number of attacks. A threat can be associated with multiple matched rules. The number of threats is typically smaller than the number of matched rules since one threat can match multiple rules.
- The Response Codes column shows the number of HTTP responses for each HTTP response code within the selected time range. Hover over the response code bar to see the number of responses per HTTP code. A high count or percentage could indicate that the endpoint is experiencing high levels of invalid input or suffering from elevated error rates. For example, it could represent clients misbehaving, servers being misconfigured, or attempts to exploit software by intentionally exercising unexpected inputs.
For detailed information about the data in the tables, see Analytical data.
Site Details
You can click a site to see API traffic details for that site. The page focuses on one site and its endpoints and includes the following:
- A graph that shows the number of rule matches in comparison to the number of blocked requests over time.
- Columns that show the number of blocked requests and total requests. The Total Requests column also shows the percentage of change over time.
- If present, the Sensitive Data column shows the number of transactions where sensitive data was detected. Any change over time is shown as a percentage.
Endpoint Details
You can click an endpoint to see API traffic details for that endpoint. The page displays data specific to one endpoint. The navigation bar includes all the endpoints and number of rule matches. You can navigate to different endpoints to view their details.
The Endpoint Details page includes the following tables.
- The tables under Details provides the following data.
- Traffic Trends. List of metrics for the endpoint along with the percentage of change of the requests within the selected time range.
- Response Code Trends. HTTP response codes, number of times they occurred within the selected time range, and the percentage change.
- If present, the Sensitive Data table shows the type of sensitive data detected in the endpoint, number of times they occurred within the selected time range, and the percentage change. The Data Type shows the type of data, such as credit card, social security number, or credentials.
- The Threats table provides details about the threats for that endpoint. You can click a threat name to open its Entity Details page. You can also click a rule name to see the activity of that rule.
If you see traffic that should be monitored, click Request a Rule to request that the ThreatX SOC write a rule for a specific situation.
Audit Log
The ThreatX platform has an audit feature that logs a number of events, such as updating users, updating sites, and adding IP addresses to whitelists and blocked lists. The audit log lists all events by category and actions. The following table lists the actions in each category.
| Category | Actions | Description |
| Lists | new_entry remove_entry | Lists are the whitelists and blocked lists. The Description column in the audit log identifies the list. The audit log monitors when IP addresses, called entries, are added to or removed from a list. |
| Rules | new_rule remove_rule update_rule | The audit log monitors whenever a rule is added, removed, or updated in the ThreatX platform. |
| Sites | new_site remove_site unset_field update_site | The audit log monitors whenever a site is added, removed, or updated in the ThreatX platform. The unset_field action occurs when a user nullifies a field within the site resource. |
| Users | new_user remove_user update_user | The audit log monitors whenever a user is added, removed, or updated in the ThreatX platform. |
| User Actions | blacklist_entity block_entity watch_entity whitelist_entity | The audit log monitors whenever a user blocks an IP address, adds an IP address to the blocked list or whitelist, or chooses to watch an IP address. Whenever a user adds an IP address to a list, the Lists category shows a new_entry action. |
Each column in the audit log has a search icon which you can use to search for a string in that column. The search feature is case sensitive and requires an exact match. The table lists all the action strings you can use to search for a specific action.
If you have access to the ThreatX API, you can access the audit logs. The following is an example command.
curl https://provision.threatx.io/tx_api/v2/logs -H 'Content-Type:
application/json' -d '{ "command":"audit_events", "token":"<api_token>",
"customer_name":"<tenant_name>", "limit": 100 }'The Blocked Requests page lists the requests that were blocked and relevant data about when and where the attack occurred that caused the threat to be blocked.
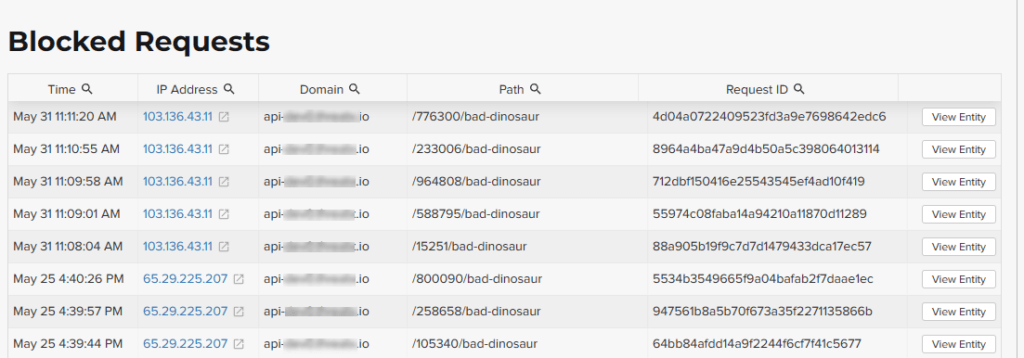
The Request ID is a random string generated to help identify every request that passes through your ThreatX sensors. This request ID is visible on every allowed request in the response header, and also is presented in the 403 message of every blocked request.
Request IDs are useful for investigating issues or blocked requests, and can be provided to the ThreatX SOC if more assistance is needed. ThreatX SOC retains the logs of all suspicious and malicious requests for 90 days, and IDs for those requests remain searchable during that time.
Click the View Entity button to be taken to that entity’s Entity Details page, where you see the full details of the request that was blocked.
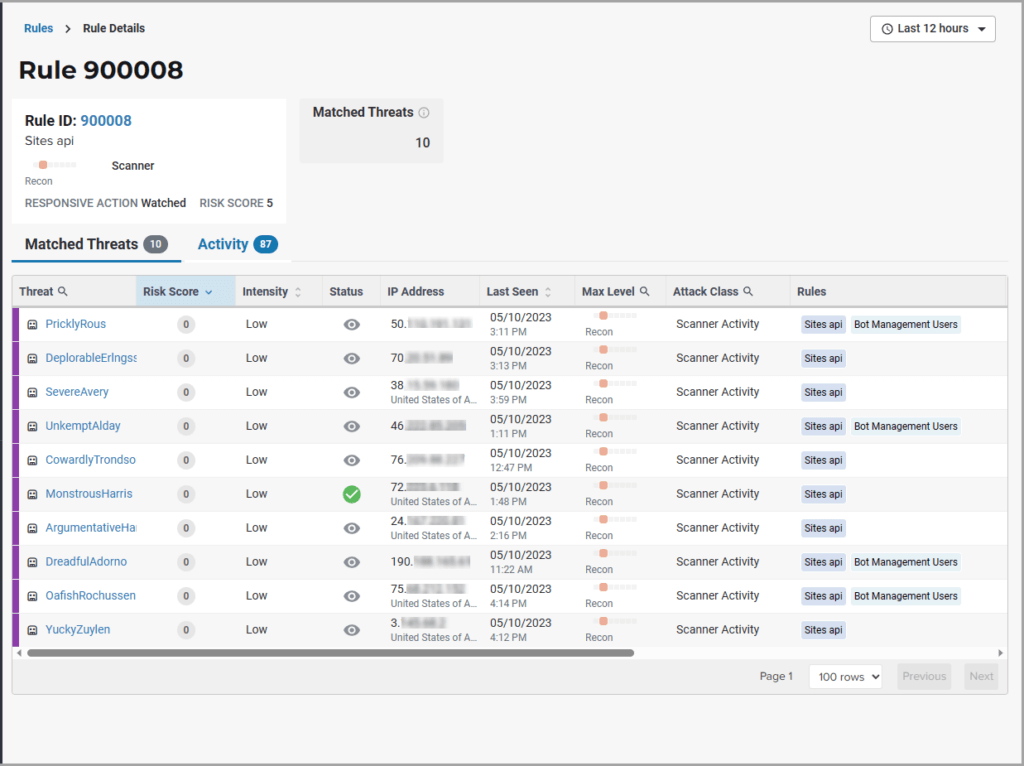
Rule Activity
The Rule Activity page, shown as Rule Details, provides data about the threats that matched the rule. This page is accessible from other pages by clicking a rule name in the Rules column.
You can use the data to determine the effectiveness of the rule and if a change is needed. For example:
- Does a threat match too many rules?
- Does the rule catch the expected threats?
Metrics
The Rule ID tile provides the ID of the rule, description and the following data:
- State that the rule assigns to a threat. The state is shown as a bar with text underneath. The state displays in various pages as the Max Level. In the previous figure, the state is Recon.
- Classification that the rule assigns to a threat. The classification displays in various pages as the attack class. In the previous figure, the classification is Scanner.
- Responsive action. Action that the rule performs when responding to a threat. The action displays in various pages as the status.
- Risk Score. Score that the rule assigns to a threat.
The Matched Threats tile shows the total number of threats that matched the rule in the selected time frame.
Matched Threats
The Matched Threats table provides data for each threat that matched the rule.
The table lists the other rules that were matched by the threat. Clicking a rule name in the Rules column displays that rule’s activity page. Clicking a rule in the Description column displays the properties for that rule. Hovering over a rule in the Rules column also highlights all instances of the same rule in the other rows.
The Match Events column shows the number of times traffic matched a rule within the selected time range and its change over time. A significant value could indicate a security problem.
You can drill into each threat to display its Entity Details page.
For detailed information about the other data in the table, see Analytical data.
Activity
The Activity table lists each attack and the time it occurred. You can drill into each threat to display its Entity Details page.
If you are unfamiliar with the Status icons, you can hover over the icon in the Status column to see its activity.
For detailed information about the other data in the table, see Analytical data.
Managing analytical data
The following sections describe the tasks you can perform to manage analytical data.
Managing threats
If your account has permission, you can manually allow, block or deny entities.
You can perform these actions from the threat’s Entity Details page, IWAF Settings, or by using the ThreatX API.
Entity Details
If the threat has interacted with your sites, you can add it to a list as follows.
- Click the threat in the Dashboard or other location to open its Entity Details page.
- Click Current Status, as shown in the following figure.
- Change it to the desired list.
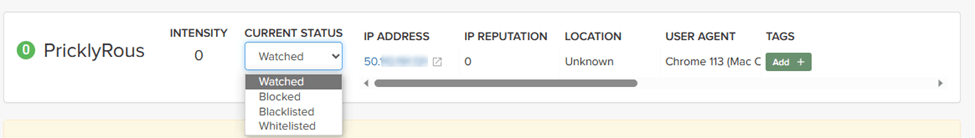
To remove a threat from a list, open Current Status and select a different list or Watched.
IWAF Settings
Click Settings in the navigation bar then select IWAF. The IWAF Settings page has a tab for Blocked IPs, Blacklisted IPs and Whitelisted IPs.
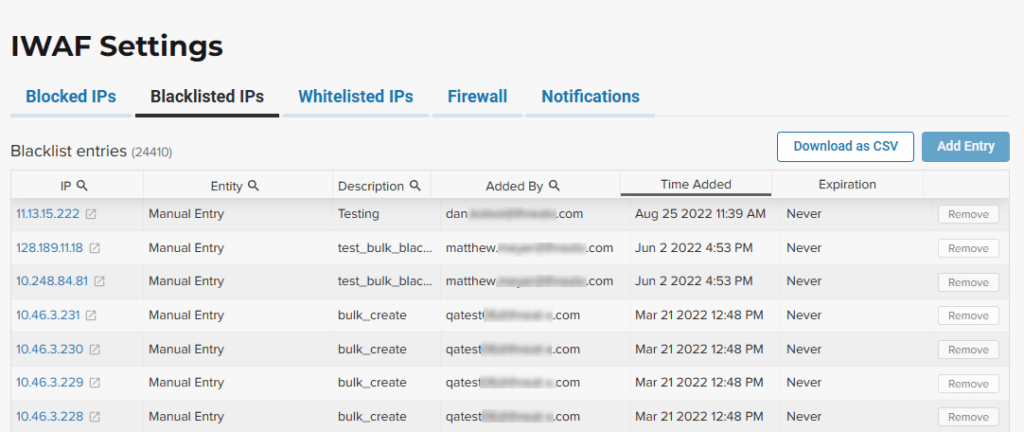
You can click each tab to view the entities in each list. In each tab, use Add Entry to add an IP address or CIDR range to the list. You are prompted to provide a reason for the action. Use the Remove button in the entity’s row to manually remove an entity.
ThreatX API
If you have access to the ThreatX API, you can use the ThreatX /tx_api/v1/lists endpoint to manage the lists. To use the endpoint, you need to know the API token and the tenant name. For details, see the API Reference Guide (requires a ThreatX account to access).
The endpoint list commands include the following:
list_blacklist, list_blocklist, list_whitelist
Lists the IP addresses currently within the list.
get_blacklist, get_blocklist, get_whitelist
Returns the details of a single IP entry.
new_blacklist, new_blocklist, new_whitelist
Adds a single IP address or CIDR.
bulk_new_blacklist, bulk_new_blocklist, bulk_new_whitelist
Adds one or more new entries.
delete_blacklist, delete_blocklist, delete_whitelist
Deletes a single entry.
bulk_delete_blacklist, bulk_delete_blocklist, bulk_delete_whitelist
Deletes one or more new entries.
The following example removes an IP address from the Block list.
curl https://provision.threatx.io/tx_api/v1/lists -H 'Content-Type: application/json' -d '{ "command":"delete_blocklist", "token":"<api_token>", "customer_name":"<tenant_name>", "ip":"1.2.3.4" } }
The response to the command is as follows:
{"Ok":"Blocklist entry for IP 1.2.3.4 removed"}
The following example adds an IP address to the Blacklist.
curl https://provision.threatx.io/tx_api/v1/lists -H 'Content-Type: application/json' -d '{ "command":"new_blacklist", "token":"<api_token>", "customer_name":"<tenant_name>", "entry":{ "ip":"1.2.3.4", "description":"Test Blacklist", "created":1} }'
The response to the command is as follows:
{ "Ok": "Blacklist entry for ip 1.2.3.4 added" }
Glossary
The ThreatX platform provides information about sites, endpoints, traffic, and threats and uses various terms to describe them. For clarity, the terms used in the ThreatX platform are defined as follows.
- API profile. Type of API such as JSON, XML, and URL-encoded.
- API traffic. Traffic that includes HTTP messages containing programmatic content sent between the site and client applications.
- Endpoint. URL pattern representing a group of resources within a site. A site can have multiple endpoints.
- Entity. A specific IP address or IP group. A suspicious entity is a threat.
- iWAF. Intelligent web application firewall. The next generation of the Web Application Firewall. See WAF.
- Non-API site. Site not served by an API server. Typically, a non-API site has web assets which are used for human interaction.
- Rule. Set of Boolean conditions that, when True, implement the rule’s defined action and risk level. A True state is also known as a match.
- Sensor. See WAF sensor.
- Site. Web property serving API responses intended for consumption by an application. Also called an API site.
- Tenant. Container for an organizational unit such as a department or company. The ThreatX platform supports multiple tenants.
- Threat. Representation of individual API clients or network of clients that have engaged in an activity that matches one or more rules and is therefore identified as suspicious or questionable. An identified threat is not necessarily malicious.
- WAF. Web Application Firewall. Type of application firewall that applies specifically to web applications. It is deployed in front of web applications and analyzes bi-directional web-based (HTTP) traffic and detects and blocks anything malicious.
- WAF Sensor. A reverse proxy-based web application firewall. Sensors monitor all the HTTP(S) traffic flows for malicious and legitimate activity. The sensor is decoupled from the analytics platform, so it can be run anywhere in the world and is used by customers with high bandwidth requirements.
Last Updated 2024-01-19